Edit chart
Loading graph
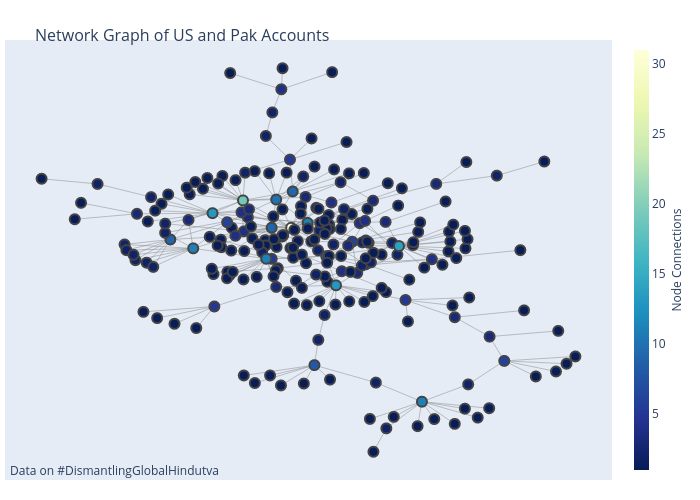
Dfracdeveloper's interactive graph and data of "Network Graph of US and Pak Accounts" is a line chart, showing net. The x-axis shows values from 0 to 0. The y-axis shows values from 0 to 0. This visualization has the following annotation: Data on #DismantlingGlobalHindutva