Edit chart
Loading graph
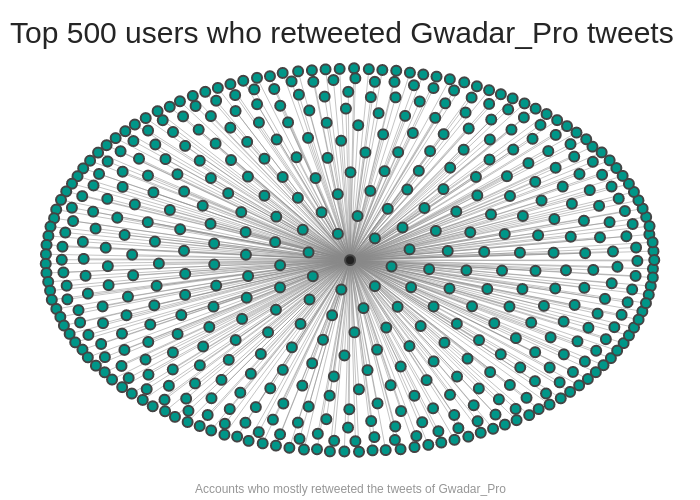
Dfracdeveloper's interactive graph and data of "" is a line chart, showing net. The x-axis shows values from 0 to 0. The y-axis shows values from 0 to 0. This visualization has the following annotations: Top 500 users who retweeted Gwadar_Pro tweets; Accounts who mostly retweeted the tweets of Gwadar_Pro