Edit chart
Loading graph
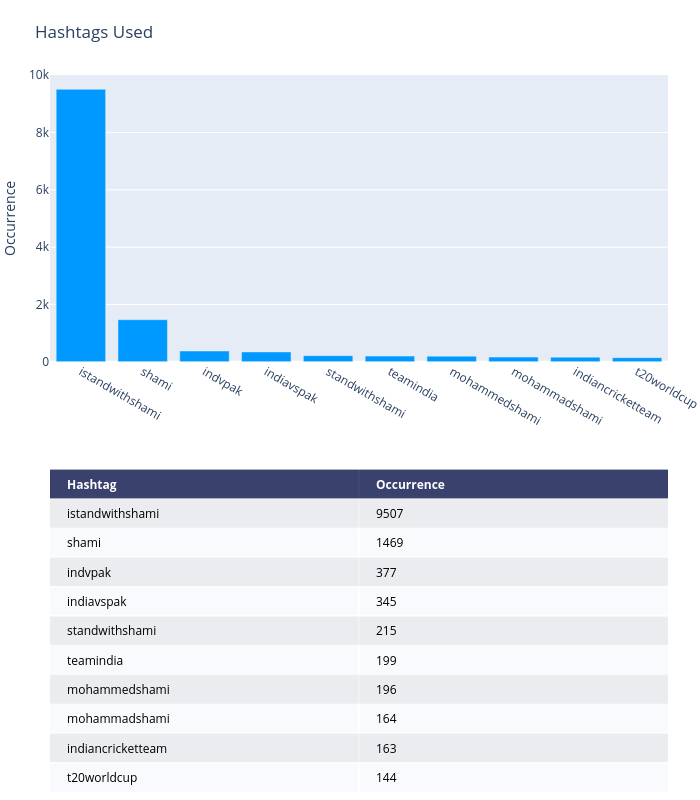
Dfracdeveloper's interactive graph and data of "Hashtags Used" is a heatmap, showing Hashtag. The x-axis shows values from 0 to 0. The y-axis shows values from 0 to 0. This visualization has the following annotations: Hashtag; Occurrence; istandwithshami; 9507; shami; 1469; indvpak; 377; indiavspak; 345; standwithshami; 215; teamindia; 199; mohammedshami; 196; mohammadshami; 164; indiancricketteam; 163; t20worldcup; 144