Edit chart
Loading graph
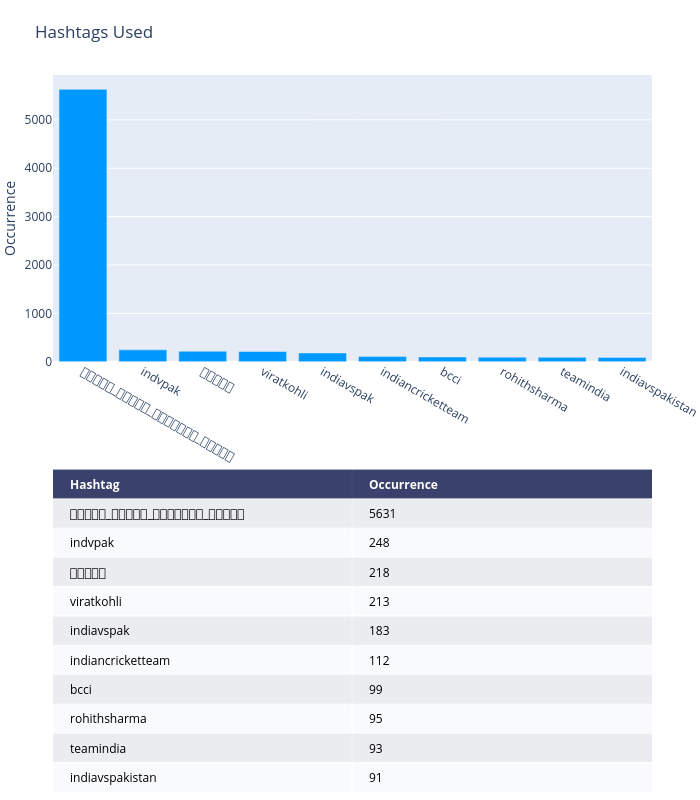
Dfracdeveloper's interactive graph and data of "Hashtags Used" is a heatmap, showing Hashtag. The x-axis shows values from 0 to 0. The y-axis shows values from 0 to 0. This visualization has the following annotations: Hashtag; Occurrence; विराट_कोहली_कप्तानी_छोड़ो; 5631; indvpak; 248; पनौती; 218; viratkohli; 213; indiavspak; 183; indiancricketteam; 112; bcci; 99; rohithsharma; 95; teamindia; 93; indiavspakistan; 91