Edit chart
Loading graph
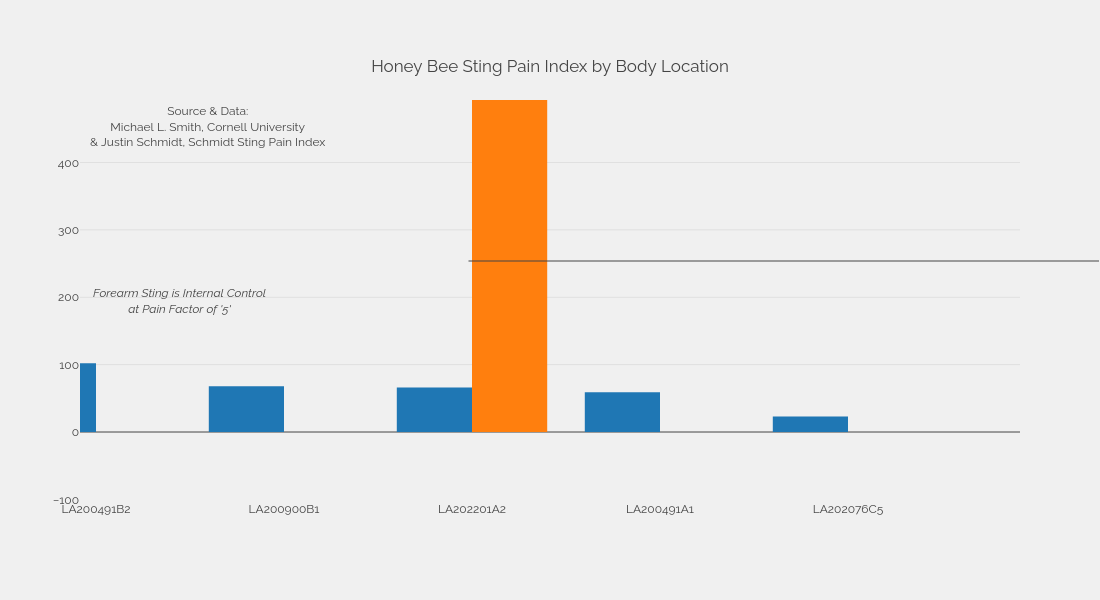
Dennis755455jp's interactive graph and data of "Honey Bee Sting Pain Index by Body Location" is a grouped bar chart. The x-axis shows values from -0.08510638297872275 to 4.914893617021276. The y-axis shows values from -100.92631578947368 to 492.7578947368422. This visualization has the following annotations: Source & Data:Michael L. Smith, Cornell University& Justin Schmidt, Schmidt Sting Pain Index; Forearm Sting is Internal Controlat Pain Factor of '5'