Edit chart
Loading graph
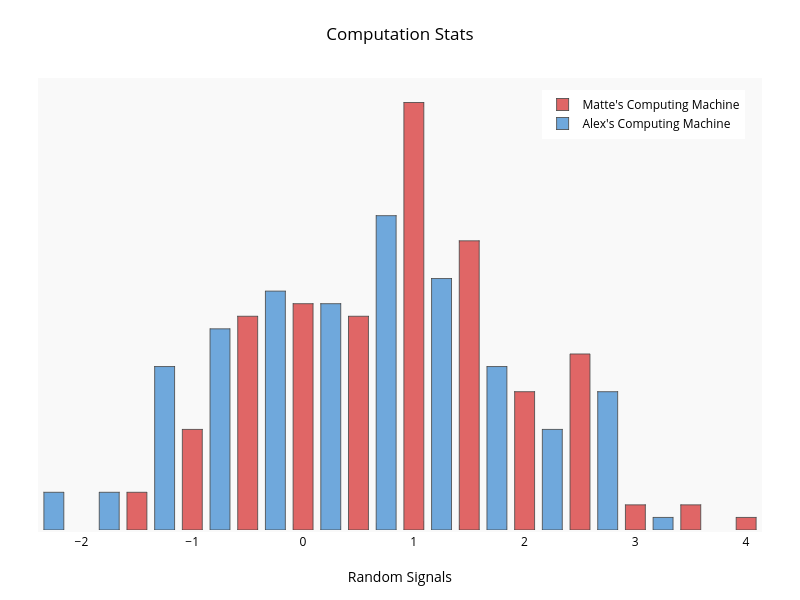
Demos's interactive graph and data of "Computation Stats" is a filled histogram, showing Matte's Computing Machine vs Alex's Computing Machine; with Random Signals in the x-axis. The x-axis shows values from -2.375 to 4.125. The y-axis shows values from 0 to 35.78947368421053.