Edit chart
Loading graph
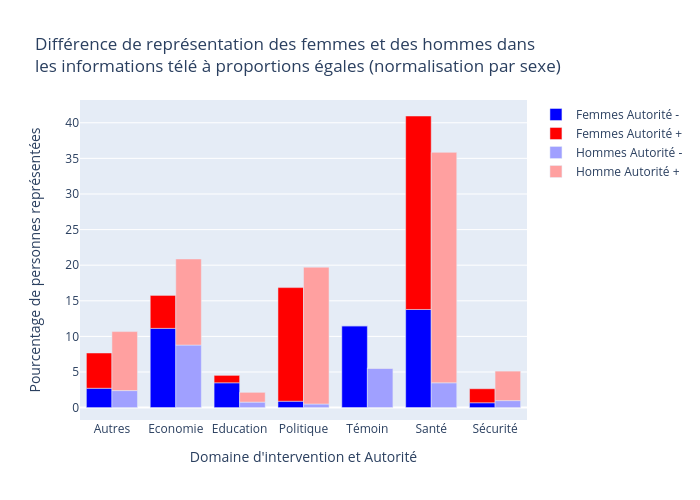
David_doukhan's interactive graph and data of "Différence de représentation des femmes et des hommes dans les informations télé à proportions égales (normalisation par sexe)" is a bar chart, showing Femmes Autorité -, Femmes Autorité +, Hommes Autorité -, Homme Autorité +; with Domaine d'intervention et Autorité in the x-axis and Pourcentage de personnes représentées in the y-axis.. The x-axis shows values from -0.5 to 6.5. The y-axis shows values from -1.741195371610758 to 43.19636373895224.