Edit chart
Loading graph
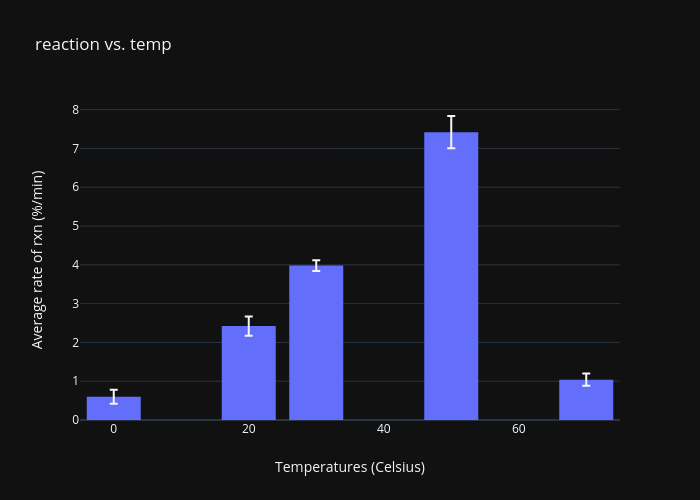
Daveyyyyyy's interactive graph and data of "reaction vs. temp" is a bar chartwith vertical error bars; with Temperatures (Celsius) in the x-axis and Average rate of rxn (%/min) in the y-axis.. The x-axis shows values from -5 to 75. The y-axis shows values from 0 to 8.24842105263158.