Edit chart
Loading graph
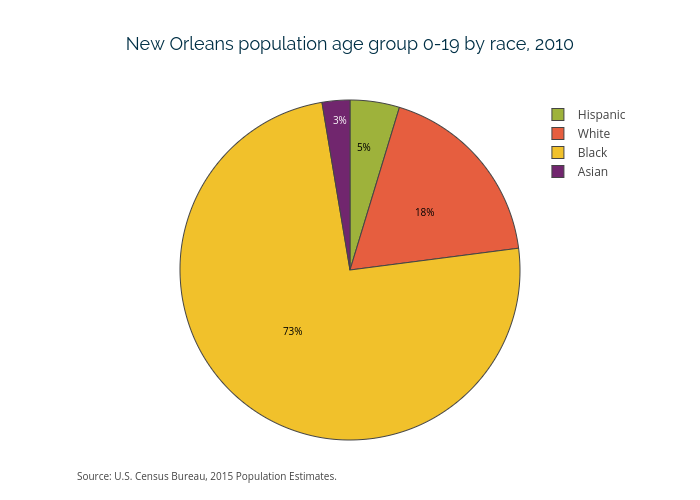
Datacenter's interactive graph and data of "New Orleans population age group 0-19 by race, 2010" is a pie. The x-axis shows values from 0 to 0. The y-axis shows values from 0 to 0. This visualization has the following annotations: 18%; 5%; 3%; 73%; Source: U.S. Census Bureau, 2015 Population Estimates.