Edit chart
Loading graph
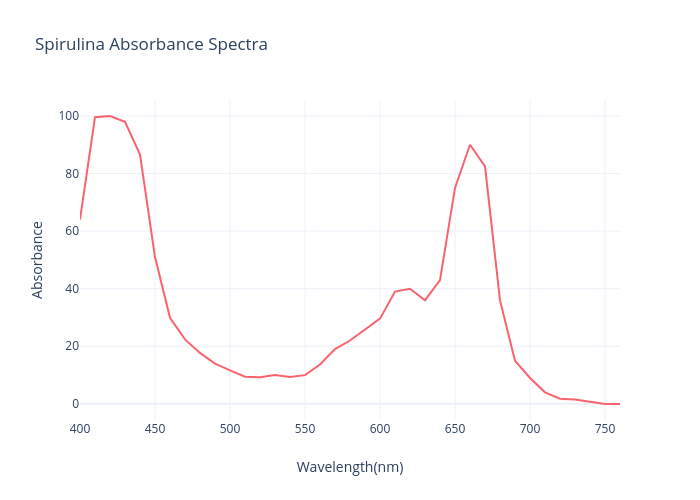
Danielleh718's interactive graph and data of "Spirulina Absorbance Spectra" is a line chart; with Wavelength(nm) in the x-axis and Absorbance in the y-axis.. The x-axis shows values from 400 to 760. The y-axis shows values from -5.6125555555555575 to 105.55855555555556.