Edit chart
Loading graph
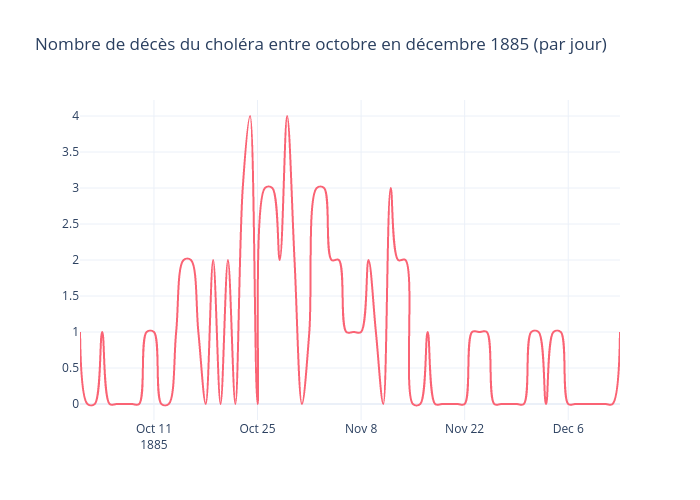
Daieuxetdailleurs's interactive graph and data of "Nombre de décès du choléra entre octobre en décembre 1885 (par jour)" is a line chart; with {'font': {'size': 10}} in the x-axis. The x-axis shows values from 1885-10-01 to 1885-12-13. The y-axis shows values from -0.2222222222222222 to 4.222222222222222.