Edit chart
Loading graph
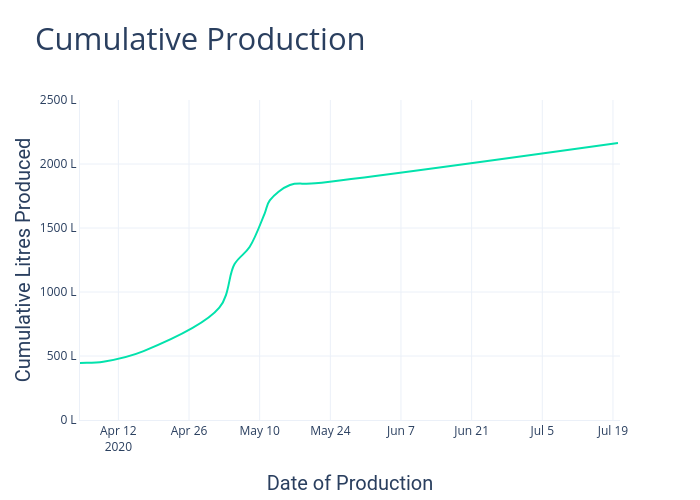
Daftbrewing's interactive graph and data of "Cumulative Production" is a line chart; with Date of Production in the x-axis and Cumulative Litres Produced in the y-axis.. The x-axis shows values from 2020-04-04 09:33:19.587 to 2020-07-20 09:33:19.587. The y-axis shows values from 0 to 2500.