Edit chart
Loading graph
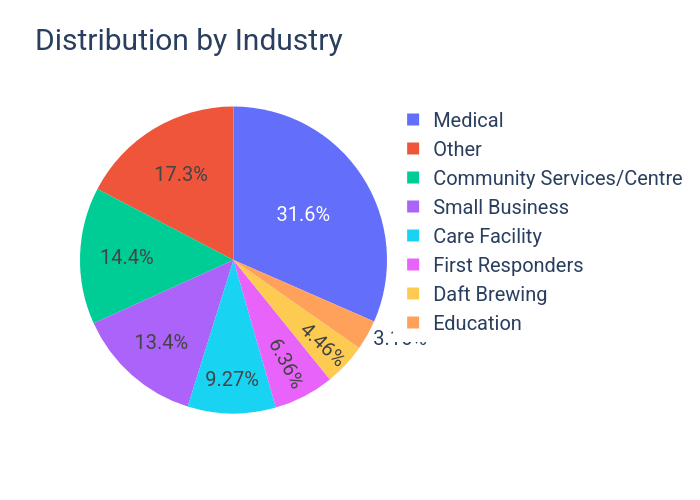
Daftbrewing's interactive graph and data of "Distribution by Industry" is a pie, showing %{meta.columnNames.y}. The x-axis shows values from -0.5 to 209.5. The y-axis shows values from -0.3333333333333334 to 6.333333333333333.