Edit chart
Loading graph
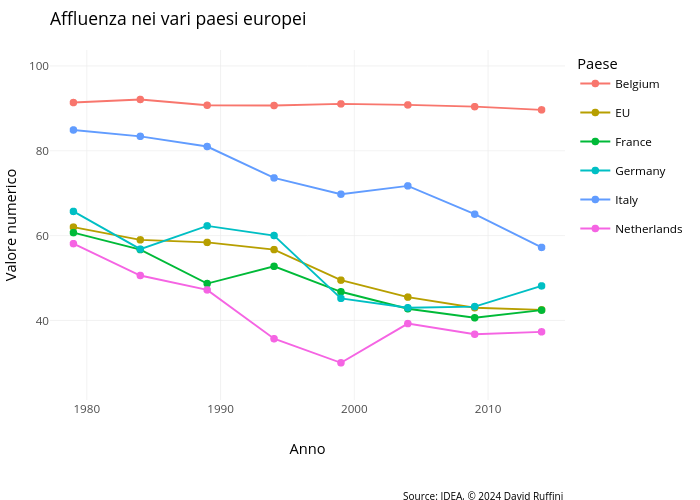
Dadoff's interactive graph and data of "Affluenza nei vari paesi europei" is a , showing Belgium, EU, France, Germany, Italy, Netherlands; with Anno in the x-axis and Valore numerico in the y-axis.. The x-axis shows values from 1977.25 to 2015.75. The y-axis shows values from 21.25 to 103.75. This visualization has the following annotation: Source: IDEA, © 2024 David Ruffini