Edit chart
Loading graph
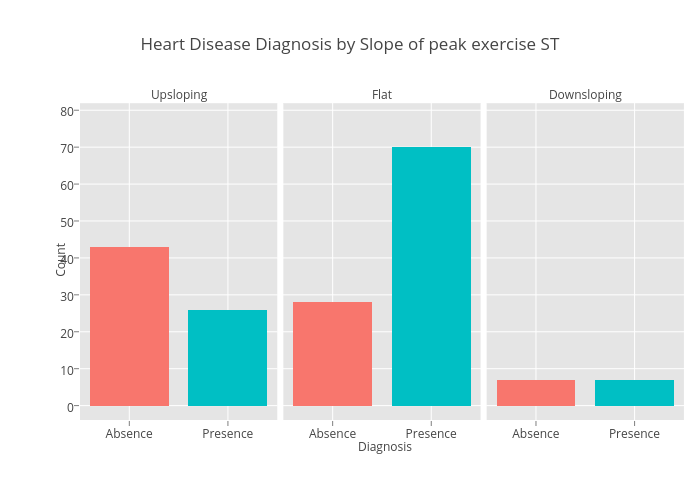
Cpatinof's interactive graph and data of "Heart Disease Diagnosis by Slope of peak exercise ST" is a stacked bar chart, showing Absence, Absence, Absence, Presence, Presence, Presence. The x-axis shows values from 0 to 0. The y-axis shows values from -3.9 to 81.9. This visualization has the following annotations: Upsloping; Flat; Downsloping; Diagnosis; Count