Edit chart
Loading graph
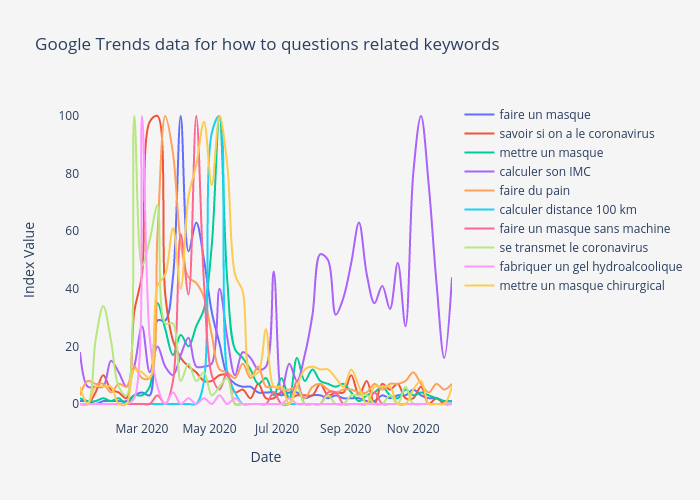
Covidtrends's interactive graph and data of "Google Trends data for how to questions related keywords" is a line chart, showing faire un masque, savoir si on a le coronavirus, mettre un masque, calculer son IMC, faire du pain, calculer distance 100 km, faire un masque sans machine, se transmet le coronavirus, fabriquer un gel hydroalcoolique, mettre un masque chirurgical; with Date in the x-axis and Index Value in the y-axis.. The x-axis shows values from 2020-01-05 to 2020-12-06. The y-axis shows values from -5.555555555555557 to 105.55555555555556.