Edit chart
Loading graph
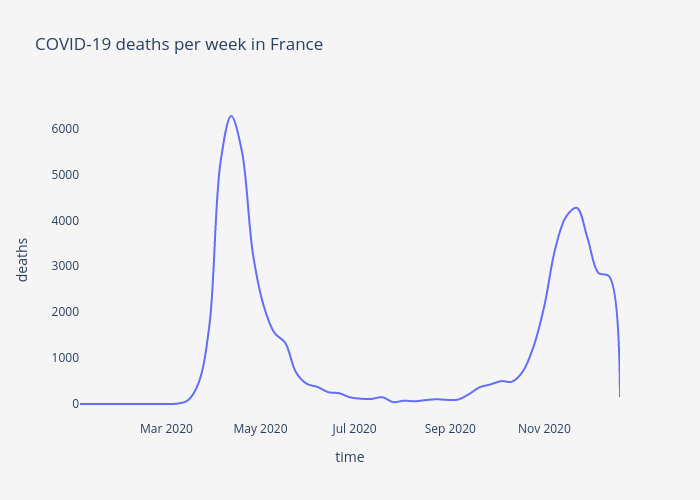
Covidtrends's interactive graph and data of "COVID-19 deaths per week in France" is a line chart; with time in the x-axis and deaths in the y-axis.. The x-axis shows values from 2020-01-05 to 2020-12-20. The y-axis shows values from -348.4444444444445 to 6620.444444444444.