Edit chart
Loading graph
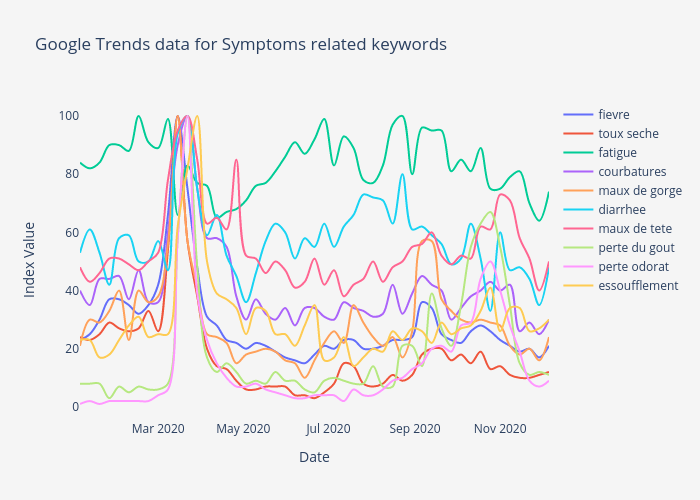
Covidtrends's interactive graph and data of "Google Trends data for Symptoms related keywords" is a line chart, showing fievre, toux seche, fatigue, courbatures, maux de gorge, diarrhee, maux de tete, perte du gout, perte odorat, essoufflement; with Date in the x-axis and Index Value in the y-axis.. The x-axis shows values from 2020-01-05 to 2020-12-06. The y-axis shows values from -4.500000000000001 to 105.5.