Edit chart
Loading graph
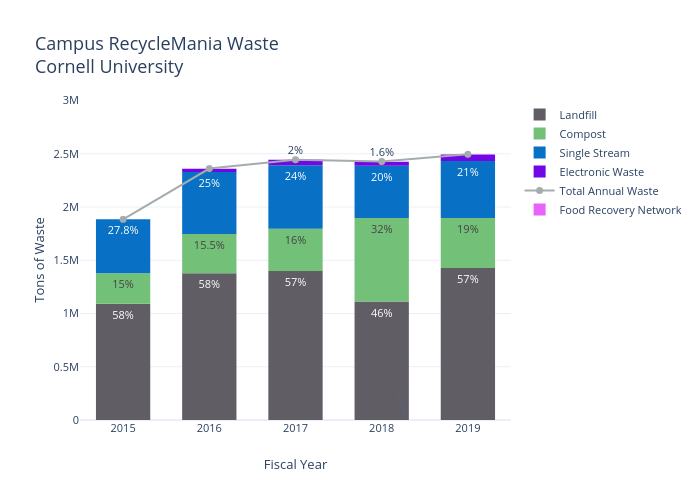
Cornellsustainability's interactive graph and data of "Campus RecycleMania WasteCornell University " is a , showing Landfill , Compost, Single Stream, Electronic Waste, Total Annual Waste, Food Recovery Network; with Fiscal Year in the x-axis and Tons of Waste in the y-axis.. The x-axis shows values from 2014.5 to 2019.5. The y-axis shows values from 0 to 3005423.5.