Edit chart
Loading graph
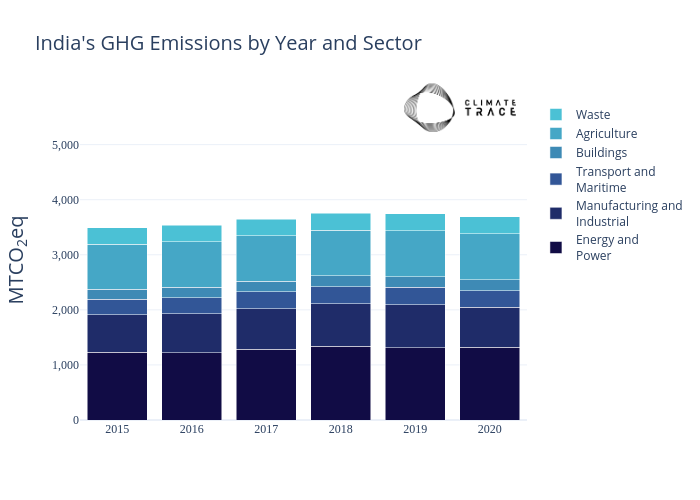
Climate_trace_plots's interactive graph and data of "India's GHG Emissions by Year and Sector" is a stacked bar chart, showing Energy andPower, Manufacturing andIndustrial, Transport andMaritime, Buildings, Agriculture, Waste; with MTCO2eq in the y-axis. The x-axis shows values from 0 to 0. The y-axis shows values from 0 to 5810.495358336635.