Edit chart
Loading graph
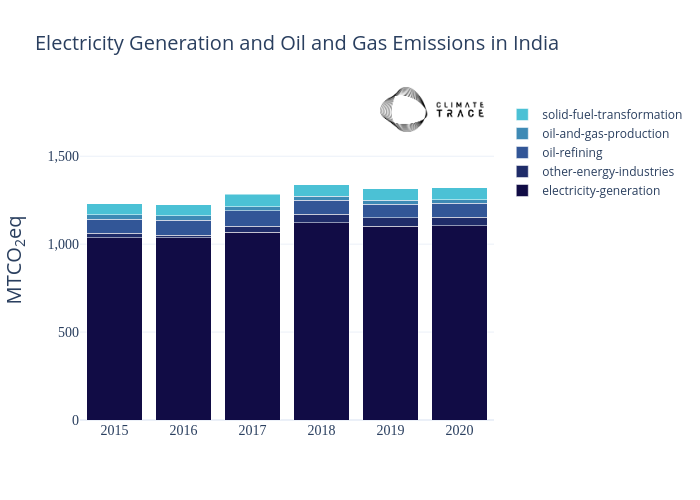
Climate_trace_plots's interactive graph and data of "Electricity Generation and Oil and Gas Emissions in India" is a stacked bar chart, showing electricity-generation, other-energy-industries, oil-refining, oil-and-gas-production, solid-fuel-transformation; with MTCO2eq in the y-axis. The x-axis shows values from 0 to 0. The y-axis shows values from 0 to 1819.68569142.