Edit chart
Loading graph
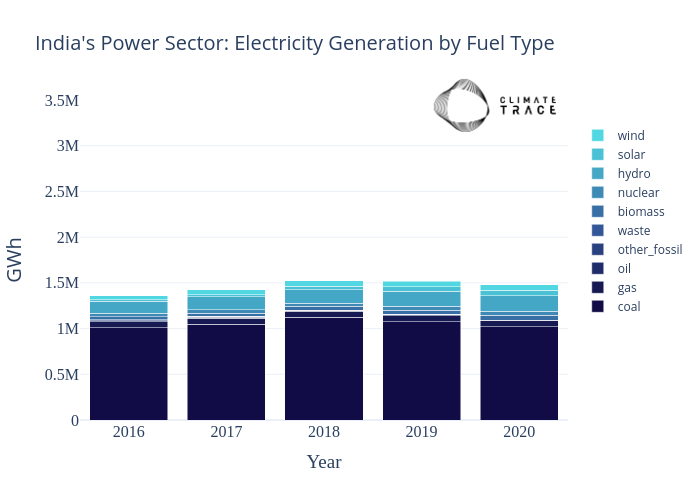
Climate_trace_plots's interactive graph and data of "India's Power Sector: Electricity Generation by Fuel Type" is a stacked bar chart, showing coal, gas, oil, other_fossil, waste, biomass, nuclear, hydro, solar, wind; with Year in the x-axis and GWh in the y-axis.. The x-axis shows values from 0 to 0. The y-axis shows values from 0 to 3500000.