Edit chart
Loading graph
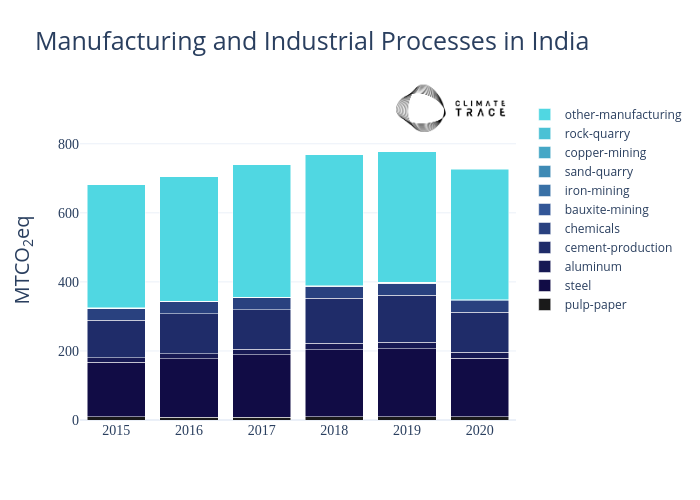
Climate_trace_plots's interactive graph and data of "Manufacturing and Industrial Processes in India" is a stacked bar chart, showing pulp-paper, steel, aluminum, cement-production, chemicals, bauxite-mining, iron-mining, sand-quarry, copper-mining, rock-quarry, other-manufacturing; with MTCO2eq in the y-axis. The x-axis shows values from 0 to 0. The y-axis shows values from 0 to 926.7349532069994.