Edit chart
Loading graph
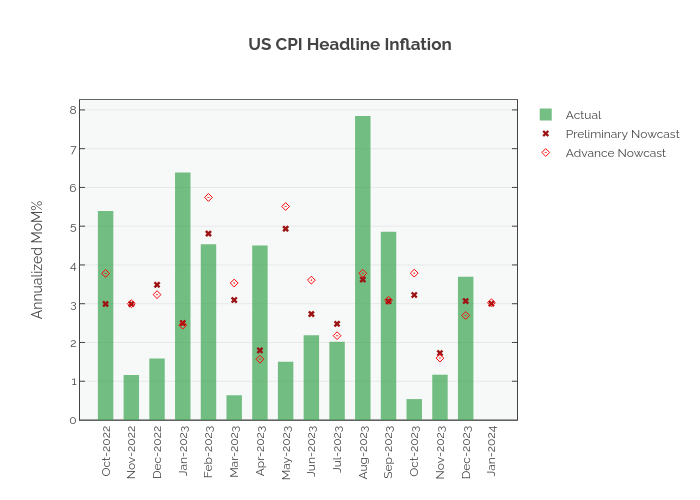
Ckara's interactive graph and data of "US CPI Headline Inflation" is a , showing Actual, Preliminary Nowcast , Advance Nowcast; with Annualized MoM% in the y-axis. The x-axis shows values from 0 to 0. The y-axis shows values from 0 to 0.