Edit chart
Loading graph
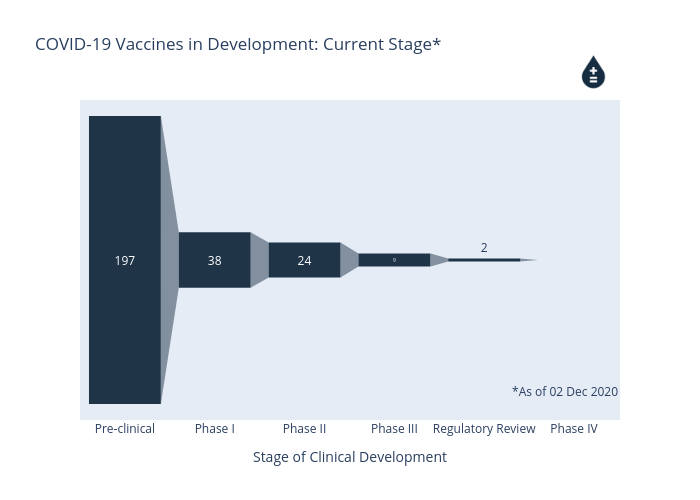
Cjmcguicken1's interactive graph and data of "COVID-19 Vaccines in Development: Current Stage*" is a funnel; with Stage of Clinical Development in the x-axis and stage in the y-axis.. The x-axis shows values from 0 to 0. The y-axis shows values from 0 to 0. This visualization has the following annotation: *As of 02 Dec 2020