Edit chart
Loading graph
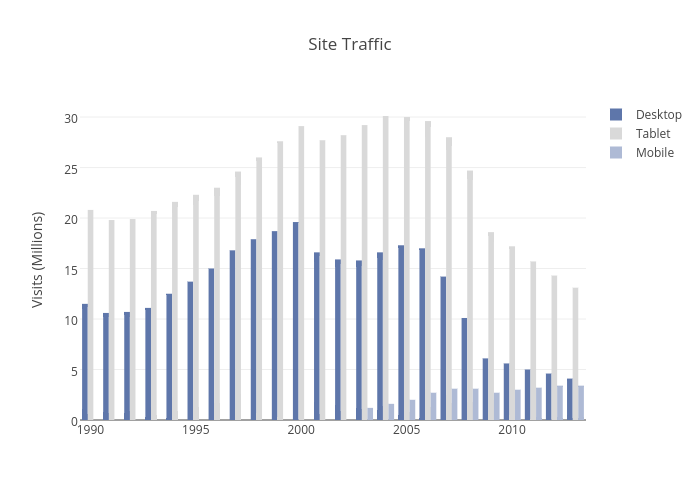
Christopherp's interactive graph and data of "Site Traffic" is a bar chart, showing Desktop, Tablet, Mobile; with time in the x-axis and Visits (Millions) in the y-axis.. The x-axis shows values from 615402000000 to 1372784400000. The y-axis shows values from 0 to 31.68421052631579.