Edit chart
Loading graph
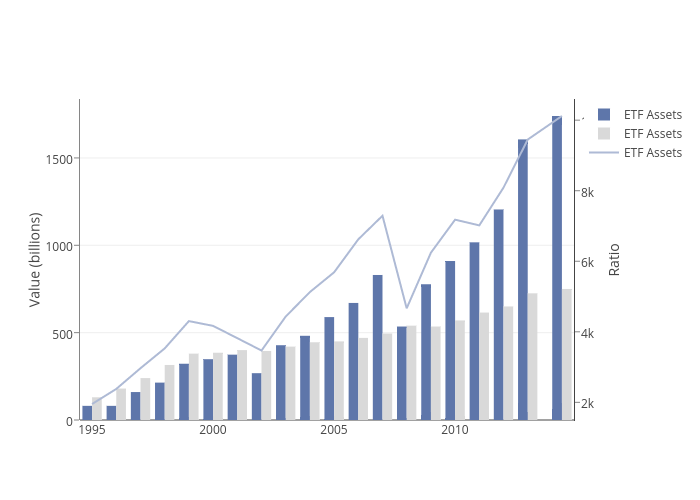
Christopherp's interactive graph and data of "Value (billions) vs time" is a bar chart, showing ETF Assets, ETF Assets, ETF Assets; with time in the x-axis and Value (billions) in the y-axis.. The x-axis shows values from 773168400000 to 1417363200000. The y-axis shows values from 0 to 1831.578947368421.