Edit chart
Loading graph
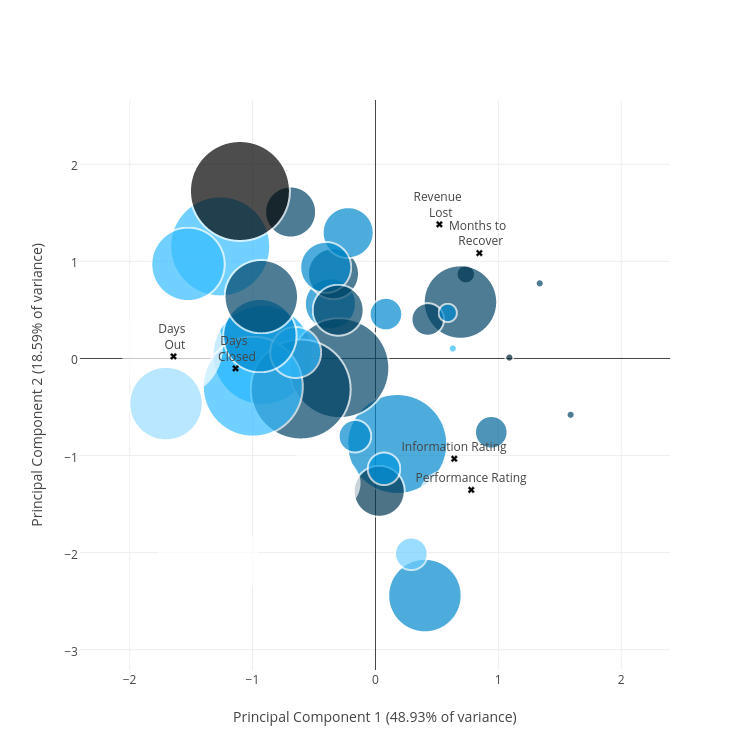
Christopherp's interactive graph and data of "Principal Component 2 (18.59% of variance) vs Principal Component 1 (48.93% of variance)" is a scatter chart, showing trace0_Principal Component 2 (18.59% of variance) vs trace1_Principal Component 2 (18.59% of variance); with Principal Component 1 (48.93% of variance) in the x-axis and Principal Component 2 (18.59% of variance) in the y-axis.. The x-axis shows values from 0 to 0. The y-axis shows values from 0 to 0.