Edit chart
Loading graph
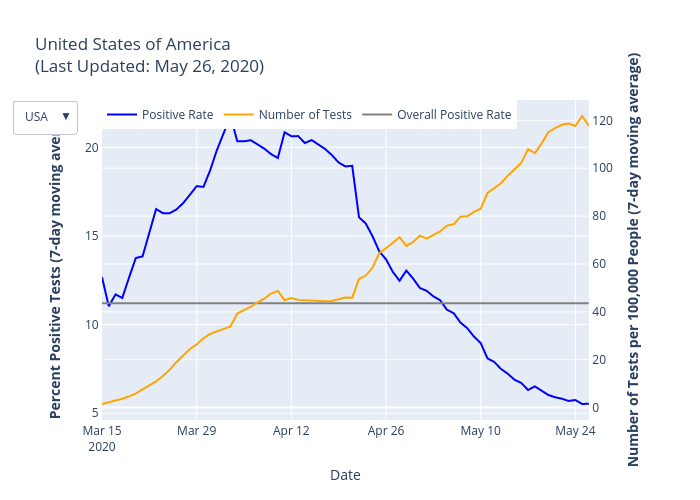
Christopherdparker's interactive graph and data of "United States of America(Last Updated: May 26, 2020)" is a scatter chart, showing Positive Rate, Number of Tests, Overall Positive Rate; with Date in the x-axis and Percent Positive Tests (7-day moving average) in the y-axis.. The x-axis shows values from 0 to 0. The y-axis shows values from 0 to 0.