Edit chart
Loading graph
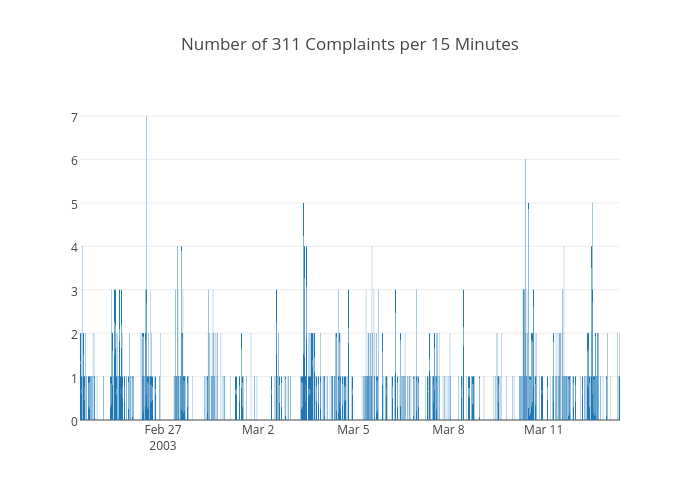
Chris's interactive graph and data of "Number of 311 Complaints per 15 Minutes" is a bar chart. The x-axis shows values from 0 to 0. The y-axis shows values from 0 to 0.