Edit chart
Loading graph
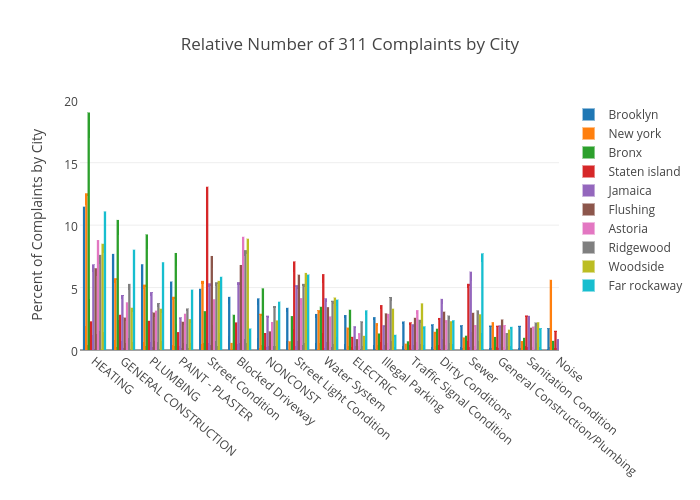
Chris's interactive graph and data of "Relative Number of 311 Complaints by City" is a grouped bar chart, showing Brooklyn, New york, Bronx, Staten island, Jamaica, Flushing, Astoria, Ridgewood, Woodside, Far rockaway; with Percent of Complaints by City in the y-axis. The x-axis shows values from -0.5 to 16. The y-axis shows values from 0 to 0.