Edit chart
Loading graph
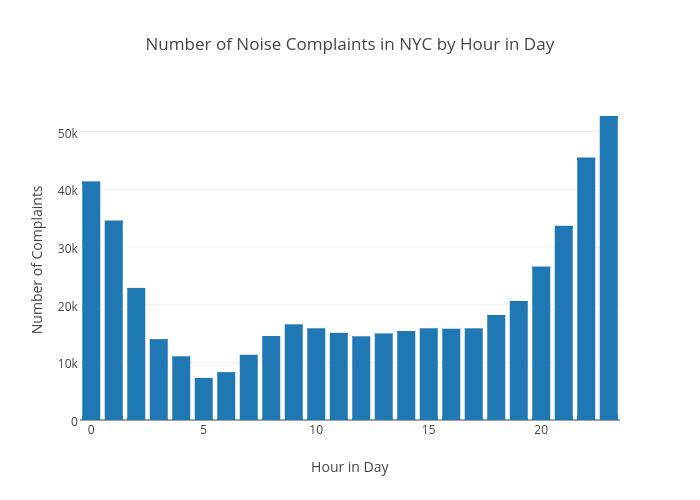
Chris's interactive graph and data of "Number of Noise Complaints in NYC by Hour in Day" is a bar chart; with Hour in Day in the x-axis and Number of Complaints in the y-axis.. The x-axis shows values from 0 to 0. The y-axis shows values from 0 to 0.