Edit chart
Loading graph
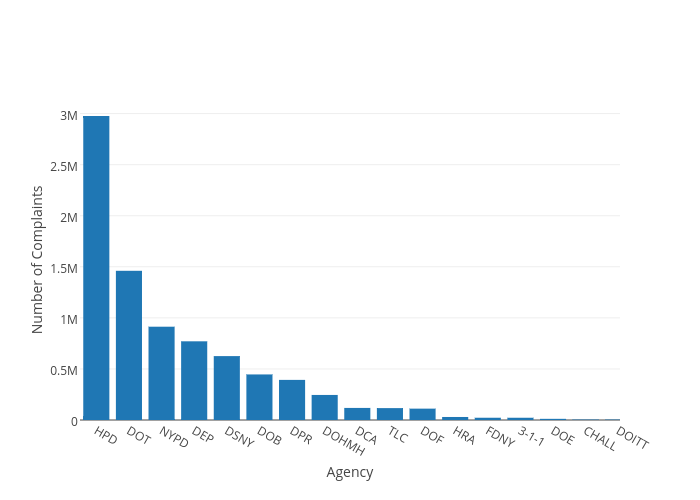
Chris's interactive graph and data of "Number of Complaints vs Agency" is a bar chart; with Agency in the x-axis and Number of Complaints in the y-axis.. The x-axis shows values from -0.5 to 16.052178318135766. The y-axis shows values from 0 to 3132810.5263157897.