Edit chart
Loading graph
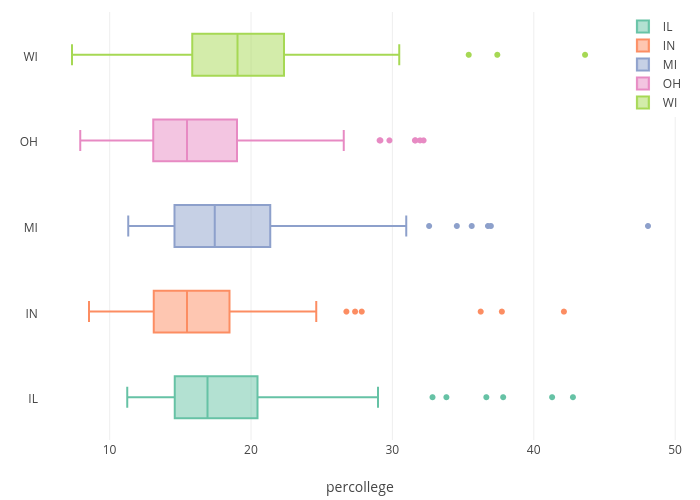
Chriddyp's interactive graph and data of "IL, IN, MI, OH, WI" is a box plot, showing IL, IN, MI, OH, WI; with percollege in the x-axis. The x-axis shows values from 5.0726414433333336 to 50.341976976666665. The y-axis shows values from -0.5 to 4.5.