Edit chart
Loading graph
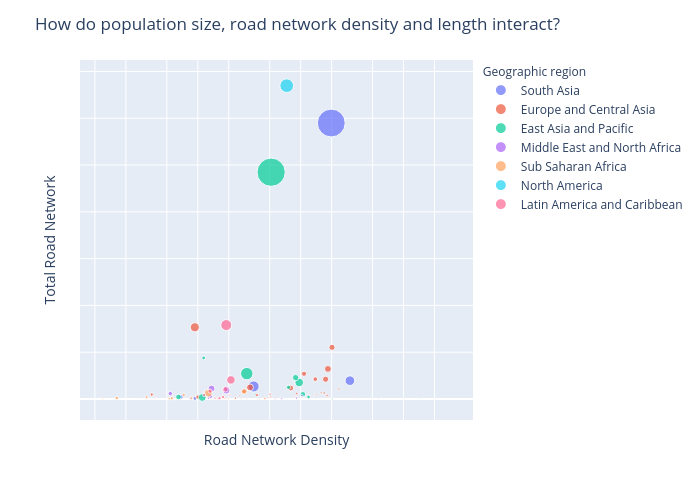
Chmarchitz's interactive graph and data of "How do population size, road network density and length interact?" is a scatter chart, showing South Asia, Europe and Central Asia, East Asia and Pacific, Middle East and North Africa, Sub Saharan Africa, North America, Latin America and Caribbean; with Road Network Density in the x-axis and Total Road Network in the y-axis.. The x-axis shows values from 0 to 0. The y-axis shows values from 0 to 0.