Edit chart
Loading graph
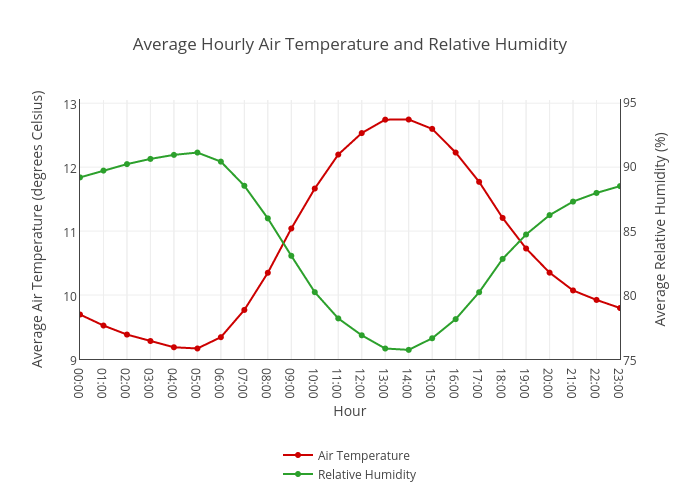
Chloecrossman's interactive graph and data of "Average Hourly Air Temperature and Relative Humidity" is a line chart, showing Air Temperature vs Relative Humidity; with Hour in the x-axis and Average Air Temperature (degrees Celsius) in the y-axis.. The x-axis shows values from 0 to 23. The y-axis shows values from 9 to 13.05.