Edit chart
Loading graph
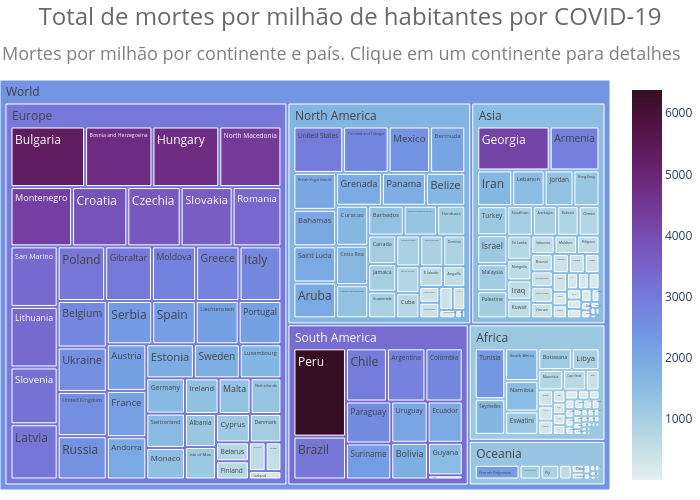
Chicolucio's interactive graph and data of "Total de mortes por milhão de habitantes por COVID-19" is a treemap. The x-axis shows values from 0 to 0. The y-axis shows values from 0 to 0. This visualization has the following annotation: Mortes por milhão por continente e país. Clique em um continente para detalhes