Edit chart
Loading graph
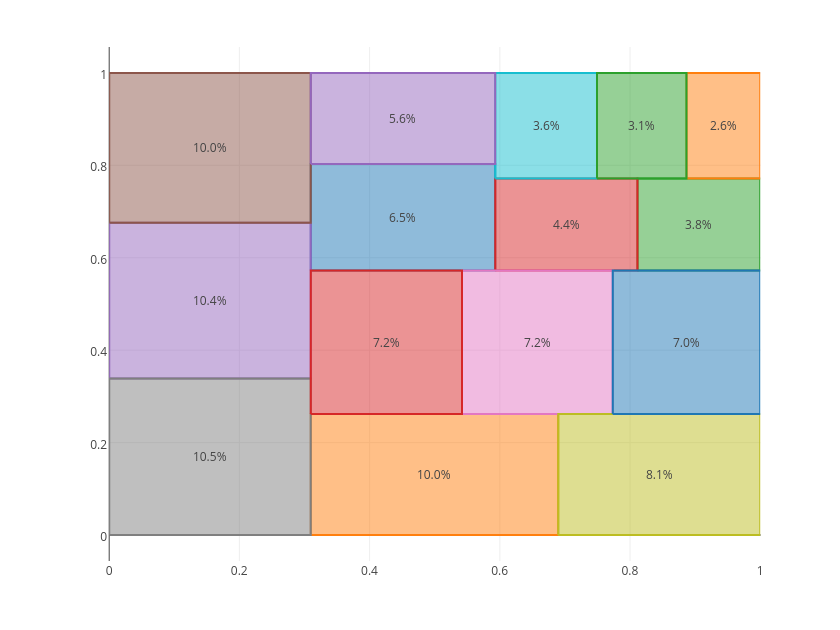
Chelsea_lyn's interactive graph and data of "" is a filled line chart. The x-axis shows values from 0 to 0. The y-axis shows values from 0 to 0. This visualization has the following annotations: ; 5.6%; 7.2%; 3.1%; 2.6%; 7.0%; 3.6%; 8.1%; 10.5%; 7.2%; 10.0%; 10.4%; 4.4%; 3.8%; 10.0%; 6.5%