Edit chart
Loading graph
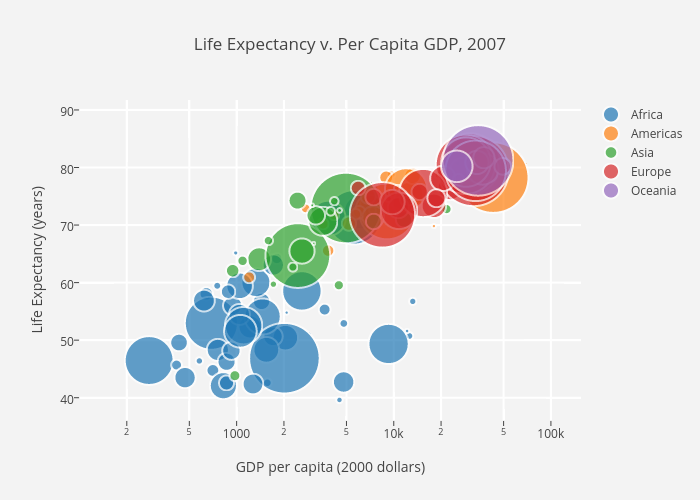
Chelsea_lyn's interactive graph and data of "Life Expectancy v. Per Capita GDP, 2007" is a scatter chart, showing Africa, Americas, Asia, Europe, Oceania; with GDP per capita (2000 dollars) in the x-axis and Life Expectancy (years) in the y-axis.. The x-axis shows values from 2.003297660701705 to 5.191505530708712. The y-axis shows values from 36.12621671352166 to 91.72921793264332.