Edit chart
Loading graph
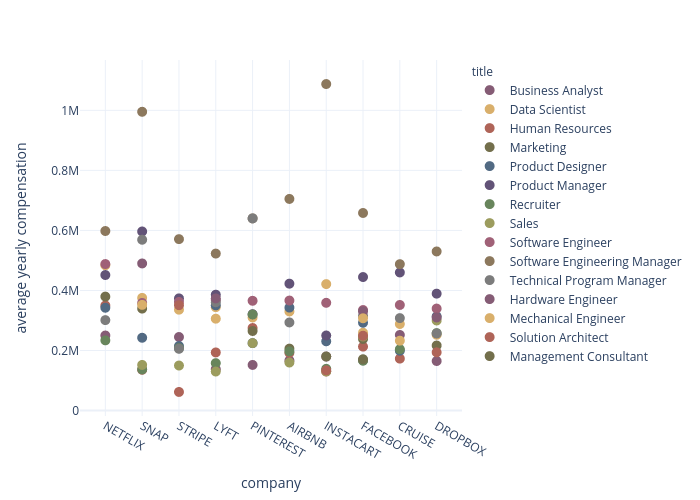
Chaeyun1248's interactive graph and data of "average yearly compensation vs company" is a scatter chart, showing Business Analyst, Data Scientist, Human Resources, Marketing, Product Designer, Product Manager, Recruiter, Sales, Software Engineer, Software Engineering Manager, Technical Program Manager, Hardware Engineer, Mechanical Engineer, Solution Architect, Management Consultant; with company in the x-axis and average yearly compensation in the y-axis.. The x-axis shows values from 0 to 0. The y-axis shows values from 0 to 0.