Edit chart
Loading graph
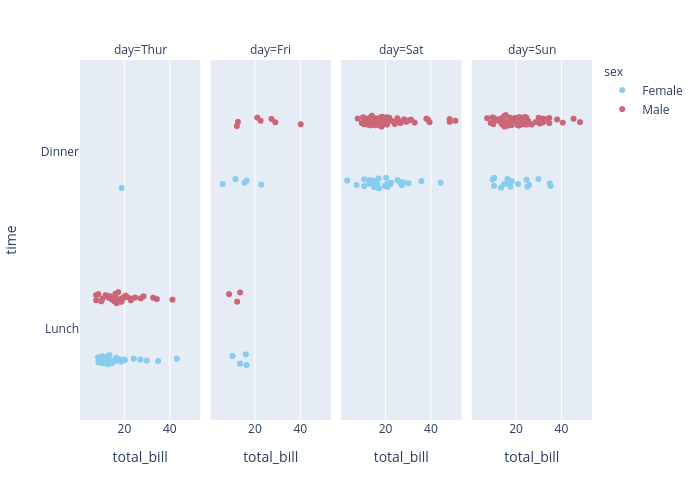
Chaeyun1248's interactive graph and data of "time vs total_bill" is a box plot, showing Female, Female, Female, Female, Male, Male, Male, Male; with total_bill in the x-axis and time in the y-axis.. The x-axis shows values from 0 to 0. The y-axis shows values from 0 to 0. This visualization has the following annotations: day=Thur; day=Fri; day=Sat; day=Sun