Edit chart
Loading graph
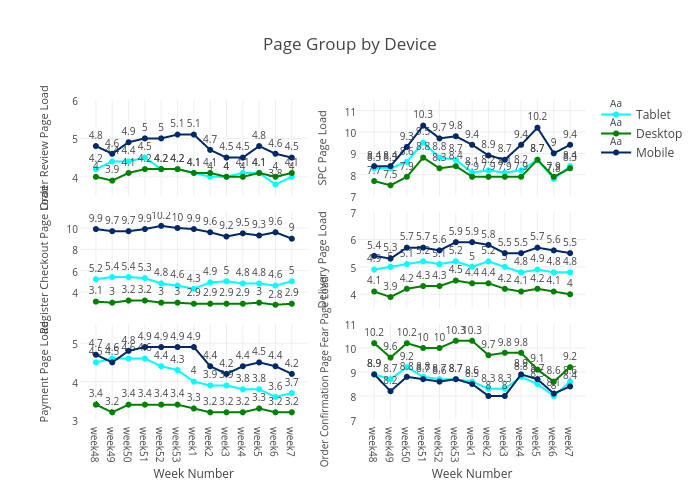
Cgamble's interactive graph and data of "Page Group by Device" is a line, showing Tablet, Desktop, Mobile, Tablet, Desktop, Mobile, Tablet, Desktop, Mobile, Tablet, Desktop, Mobile, Tablet, Desktop, Mobile, Tablet, Desktop, Mobile; with Week Number in the x-axis and Payment Page Load in the y-axis.. The x-axis shows values from 0 to 0. The y-axis shows values from 3.0 to 5.5.