Edit chart
Loading graph
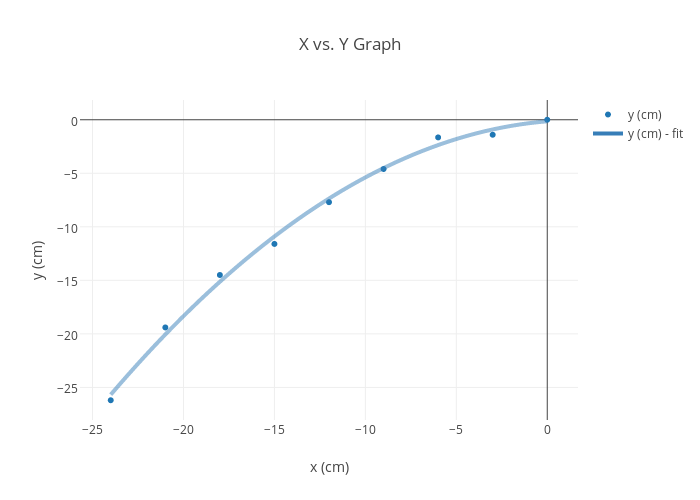
Cewoo1's interactive graph and data of "X vs. Y Graph" is a scatter chart, showing y (cm) vs y (cm) - fit; with x (cm) in the x-axis and y (cm) in the y-axis.. The x-axis shows values from -25.52260778128286 to 1.5226077812828607. The y-axis shows values from -28.1082944530845 to 1.9082944530845.