Edit chart
Loading graph
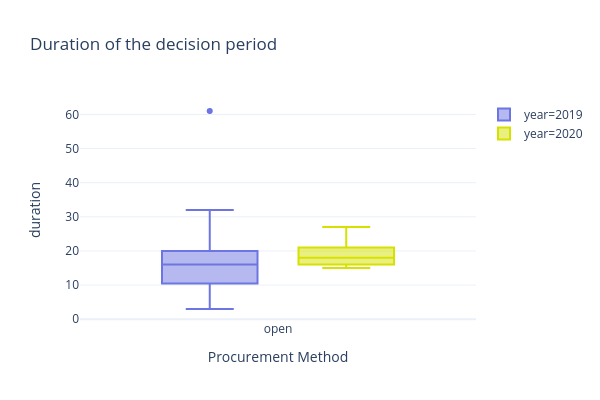
Camilaocp's interactive graph and data of "Duration of the decision period" is a box plot, showing year=2019 vs year=2020; with Procurement Method in the x-axis and duration in the y-axis.. The x-axis shows values from 0 to 0. The y-axis shows values from 0 to 0.