Edit chart
Loading graph
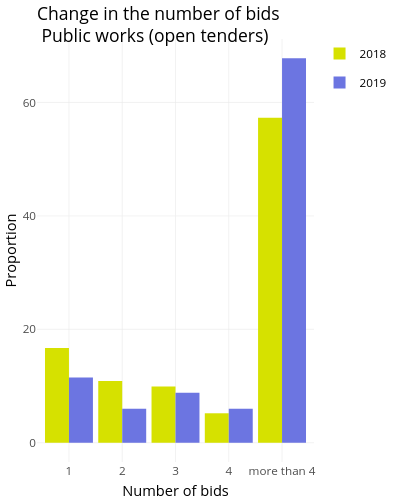
Camilaocp's interactive graph and data of "Change in the number of bids Public works (open tenders)" is a , showing 2018 vs 2019; with Number of bids in the x-axis and Proportion in the y-axis.. The x-axis shows values from 0.4 to 5.6. The y-axis shows values from -3.39 to 71.19.