Edit chart
Loading graph
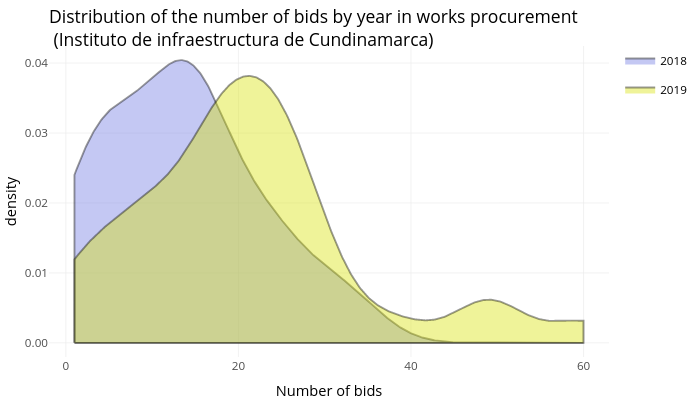
Camilaocp's interactive graph and data of "Distribution of the number of bids by year in works procurement (Instituto de infraestructura de Cundinamarca)" is a filled line chart, showing 2018 vs 2019; with Number of bids in the x-axis and density in the y-axis.. The x-axis shows values from -1.95 to 62.95. The y-axis shows values from -0.00202090081187321 to 0.0424389170493375.