Edit chart
Loading graph
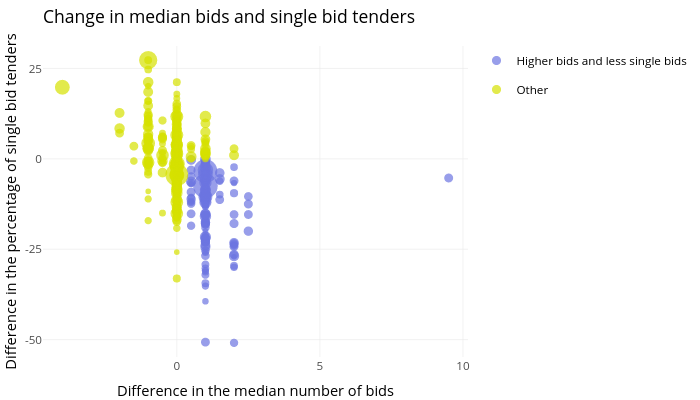
Camilaocp's interactive graph and data of "Change in median bids and single bid tenders" is a scatter chart, showing Higher bids and less single bids vs Other; with Difference in the median number of bids in the x-axis and Difference in the percentage of single bid tenders in the y-axis.. The x-axis shows values from -4.675 to 10.175. The y-axis shows values from -54.81 to 31.21.