Edit chart
Loading graph
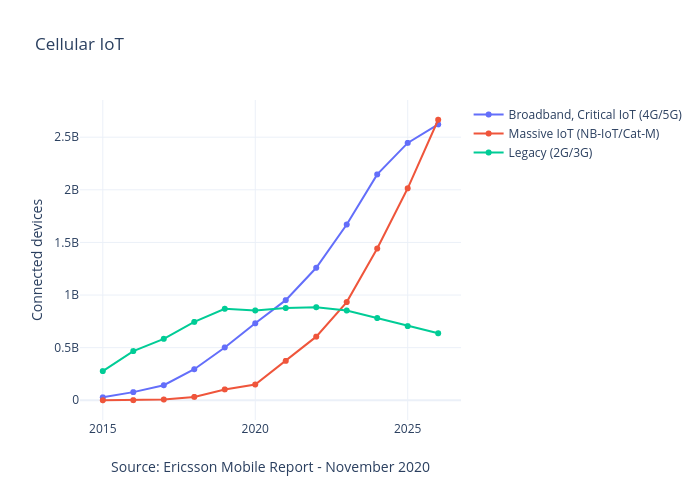
Caiocolagrande's interactive graph and data of "Cellular IoT" is a , showing Broadband, Critical IoT (4G/5G), Massive IoT (NB-IoT/Cat-M), Legacy (2G/3G); with Source: Ericsson Mobile Report - November 2020 in the x-axis and Connected devices in the y-axis.. The x-axis shows values from 2014.300116211505 to 2026.699883788495. The y-axis shows values from -207471502.68817204 to 2873352502.688172.