Edit chart
Loading graph
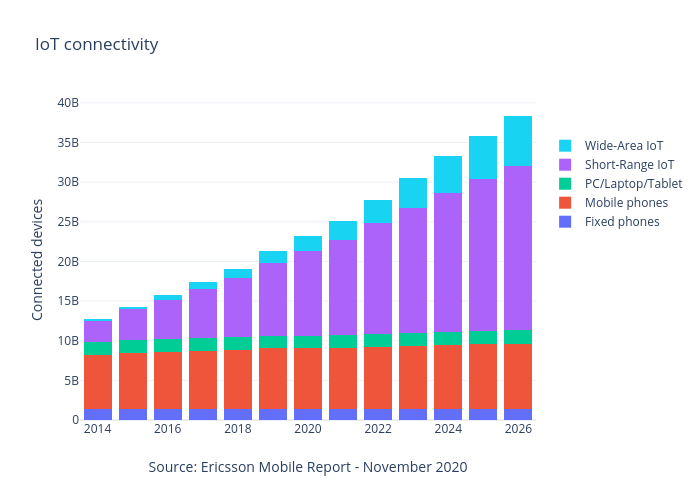
Caiocolagrande's interactive graph and data of "IoT connectivity" is a stacked bar chart, showing Fixed phones, Mobile phones, PC/Laptop/Tablet, Short-Range IoT, Wide-Area IoT; with Source: Ericsson Mobile Report - November 2020 in the x-axis and Connected devices in the y-axis.. The x-axis shows values from 2013.5 to 2026.5. The y-axis shows values from 0 to 40363157894.73684.