Edit chart
Loading graph
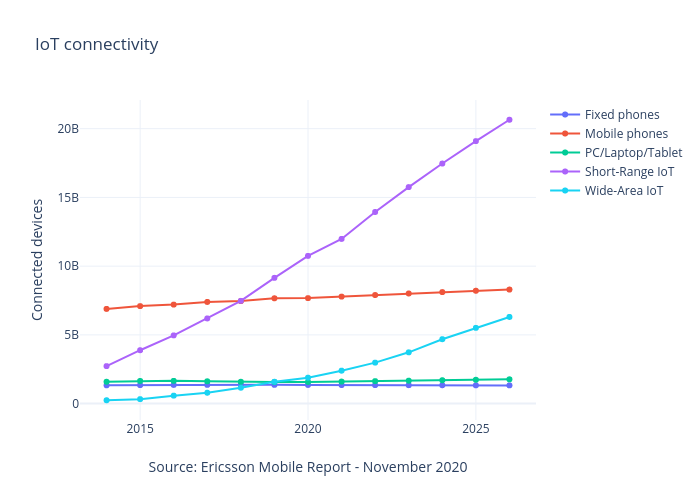
Caiocolagrande's interactive graph and data of "IoT connectivity" is a , showing Fixed phones, Mobile phones, PC/Laptop/Tablet, Short-Range IoT, Wide-Area IoT; with Source: Ericsson Mobile Report - November 2020 in the x-axis and Connected devices in the y-axis.. The x-axis shows values from 2013.247555326814 to 2026.752444673186. The y-axis shows values from -1296309352.5179858 to 22190309352.517986.